
[vc_row][vc_column][vc_column_text]
WANT TO KNOW HOW HOUSING PRICES HAVE CHANGED AT A NEIGHBORHOOD LEVEL?
Every quarter I am pleased to bring to you the latest Denver Metro Price Change Maps. This tool is created and developed by Your Castle Real Estate to give you a clear sense of current real estate trends in each metro Denver neighborhood. For the first time, we can look inside each neighborhood and see what the real estate market looks like at a hyper-local level so you can make a better decision whether you’re buying, selling or investing. Please take a moment to review the map; I think you will find it very interesting!
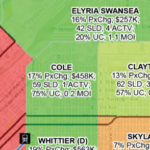 Here’s how to read the map. Pick a neighborhood that interests you, say Cole in Central Denver. During the past 12 months in Cole, home values have increased by 17% and the average sales price is $458,000. There have been 59 sales and only one home is currently for sale. Moreover, there is only 0.2 months of inventory (MOI), meaning all available homes sell as quickly as they go on the market.
What does this tell us about Cole? It tells us that prices have been rising swiftly in the past year (low DOM and increasing prices) and the inventory is very low which will help sellers in the neighborhood. With currently only 0.2 MOI (6 months of supply is a balanced market) this is a red hot neighborhood.
A sample of neighborhoods is below. If you don’t see the area you need, give me a call at 303-960-9165 or email me and I’ll chase down the price change map for your specific neighborhood.[/vc_column_text][/vc_column][/vc_row][vc_row][vc_column width=”1/3″][vc_single_image image=”2831″ add_caption=”yes” alignment=”center” onclick=”link_image”][/vc_column][vc_column width=”1/3″][vc_single_image image=”2832″ add_caption=”yes” alignment=”center” onclick=”link_image”][/vc_column][vc_column width=”1/3″][vc_single_image image=”2833″ add_caption=”yes” alignment=”center” onclick=”link_image”][/vc_column][/vc_row][vc_row][vc_column width=”1/2″][vc_single_image image=”2834″ add_caption=”yes” alignment=”center” onclick=”link_image”][/vc_column][vc_column width=”1/2″][vc_single_image image=”2835″ add_caption=”yes” alignment=”center” onclick=”link_image”][/vc_column][/vc_row]